Hello New England Cytometrists! As a followup to our save the date for the Fall Meeting to be held on Thursday, November 5, 2026, we are pleased to announce that this year, we are adding an oft-requested POSTER SESSION! Due to limited space, we will be accepting abstracts until August 31, and will select the top entries to give a flash talk during the meeting. Details and application in this link: https://forms.gle/9TuRzhWJbZ37GPju7
Stay tuned for the agenda announcement and registration site link, coming soon!
Stealing the message that was sent to the Boston flow email list:
We’re excited to share that NECyto’s 2026 Annual Meeting will be held on November 5th, 2026 at Moderna!
As we begin planning, we would greatly appreciate your input to shape this year’s meeting. Your feedback will help us create an agenda with topics and formats that are most valuable to our community.
Only 2 more days until the return of NECyto’s fall meeting! I know you have all been anxiously awaiting the itinerary, you will find it pasted below. Please note, our hosts have asked that we use the entrance on Fulkerson Street (the star on the map) just around the corner from the Binney Street entrance.
And our itinerary for the day, I look forward to seeing everyone! –Mike
Hello flow community! I hope everyone had a fun Halloween, only 10 days until NECyto 2025 on Thursday, November 13! I’m pleased to announce our speaker lineup for this year, we will post the agenda and actual order of talks later this week:
Hsiao Hsuan Kuo, Moderna Tx: “Functional Profiling Using High Parameter Spectral Cytometry for Clinical Phase Studies in Vaccine Development”
Daniel Vocelle, St Jude Children’s Research Hospital: “Applications of Imaging Cytometry: From Technology to Discovery”
Spencer Shah, Broad Institute: “Exploring the use of imaging-based flow cytometers for functional genomics”
Mikhail Roshal, Memorial Sloan Kettering Cancer Center: “Myeloid neoplasms through the lens of high parameter flow cytometry”
Wayne Austin, Beam Tx: “Epitope engineering for in vivo enrichment of gene edited therapies”
To register, visit https://www.eventbrite.com/e/necyto-2025-tickets-1736133153999?aff=oddtdtcreator We appreciate the hospitality of our hosts, Moderna. There are additional security registration steps required, so please register this week if you can! All activities for the meeting will be at the Moderna facility at 325 Binney Street, Cambridge MA. Registration and breakfast starts at 8, and we will be heading back to MEX on Main Street, Cambridge, for the “Impromptu BBG” after the meeting.
On behalf of the organizing committee, we hope you can join us, and meet the new committee members! Mike Waring President
Another year has passed, and the annual Fall meeting is back! We are all settled into our new spaces, and this years meeting will also be in a new space: the Moderna Facility on Binney Street in Cambridge MA. Join us on November 13th for 5 talks and a vendor fair. We will be releasing the speaker list next week, as we finalize the talk titles. I was cleaning out some papers and came across the agenda for our “Immunity and Immune Function in AIDS–Cytometric Methods” meeting from October 5, 2004, if you want to see what we were talking about 21 years ago click here!
We also have a few new committee members joining us this year, so we look forward to introducing them. There will be an “Impromptu BBG” after the meeting.
There will also be a “scheduled” BBG on Monday November 3, we hope you will join us for one or both of the upcoming events! Keep an eye on the mailing list for details (you can sign up on the “contact us” page).
Hello New England Cytometry users! I cant believe its been almost a year since the last post here, I had sent out notices on the mailing lists and social media that we would be skipping the fall meeting this year, but never posted it here! We are still getting settled into our new building for the Ragon Institute, and there are lots of changes. We do have an open position in the flow core, there is a technician level job posting here: https://partners.taleo.net/careersection/ex/jobdetail.ftl?job=3301915
but we are also considering a more experienced position instead, so if you have 5+ years and would be interested in joining our team, let me know!
Monday October 7 we will have our monthly happy hour (or “BBG”) at MEX in Cambridge (500 Technology Square), across the street from the new building (600 Main Street). I’ll be happy to bring folks over in smaller groups to see the new space. Go to the “Contact us” page for the link to sign up for our distribution list if you arent on it already. Looking forward to seeing some of you soon!
Mike W
A HUGE Thank you to all of the attendees and vendors that joined us on October 12th for our fall meeting! Presentations are posted to the “Meetings” page, and it looked like everyone had a great time at MEX for the happy hour! The hostess said we were a really fun group and they’d be happy to host us again, so thank you everyone for being on your best behavior!
In over eleventy one months of running our social media accounts, I update half of them half as often as I should like, but I hope you like more than half the posts half as well as they deserve! We will try to post more in the coming year. We were thrilled to have Akos bring his camera, and he was busy all day! Enjoy the pictures on Facebook and Instagram, hopefully more to come. If you have any pictures to share, please send them our way or post them to the page!
Our 2023 fall meeting is only 2 days away! We will be able to provide parking at the 800 Tech Square Garage for $10 for the day, look for the signs for NECyto. Registration and check-in will be in the atrium of 100 Tech Square, vendors please do not enter before 7AM, attendees are invited to come for breakfast starting at 8AM. Talks will begin at 9am in the first floor auditorium of 400 Tech Square across the street. Attendees and vendors are invited to attend a post-meeting gathering at MEX in 500 Tech Square, lets keep the conversations going! We are looking forward to seeing everyone!
Registraion for the 2023 New England Cytometry User group meeting on Thursday, October 12, 2023 is now open! Use the button below to register on Eventbrite:
The meeting will be held at 400 Technology Square in Cambridge MA in the Ragon Institute’s Schwartz Auditorium for a day of talks, and a vendor fair in the atrium of 100/200 Tech Square. Breakfast will be available at 8. Speakers will include Sami Farhi (Broad Institute), Vera Tang (University of Ottawa), David Ng (University of Utah School of Medicine), Peter Lopez (NYU), Thomas Diefenbach (Ragon Institute), and a presentation from the Organizing Committee. Stick around afterwards for the “impromptu” happy hour. The full agenda will be posted to https://newenglandcytometry.com/meetings/ soon!
If you are retired and would like to attend, please contact us directly! Any vendors that are interested in additional sponsorship opportunities, also please reach out. Additional vendor information will be sent to registrants (venue access, shipping information).
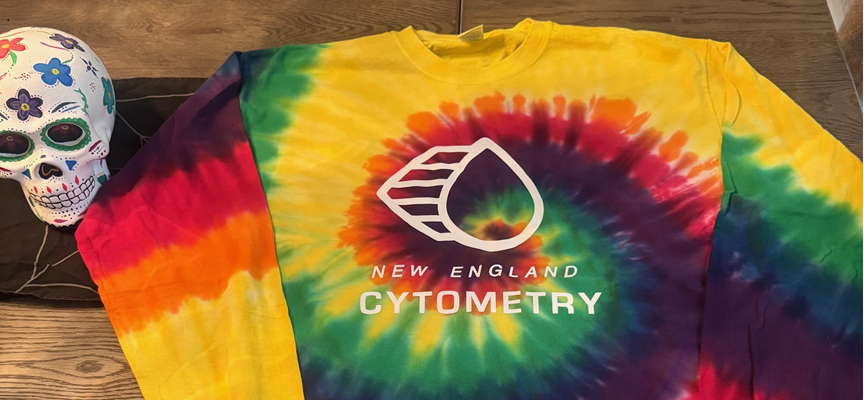
Please save the date for the 2023 Fall NECyto meeting, to be held on Thursday October 12, 2023 returning to the Ragon Institute at 400 Tech Square in Cambridge! We will be opening up the registration site in the next couple of weeks, along with announcing the speaker list, but I wanted to assure our community that the meeting is happening and we are looking forward to welcoming everyone to Tech Square one last time, before the big move across the street! Be sure to pick up this year’s t-shirt, having done the visible spectrum:
this year we’re going UV!
We hope you’ll be visible at the meeting!
Mike Waring President, NECyto User Group Director, Ragon Institute Imaging Core Facility