

I experienced #10 the other day, and thought it presented a good opportunity to demonstrate the usefulness of spectraviewers and the importance of knowing your reagents. I’ve compiled a list of spectraviewers on this site, feel free to suggest additional links: (https://newenglandcytometry.com/cytometry-related-links/spectraviewers/), but even then as I have lamented earlier, you can’t always compare your fluorochromes that are proprietary dyes from different vendors. Biolegend has some cross-vendor spectra, but their selection is not complete (only a portion of the Live/Dead fixable dyes are shown). The panel selection program Fluorofinder (fluorofinder.com) can show spectra for each of the dyes in their multi-vendor database, but don’t yet have a spectraviewer tool to view multiple fluors on the same plot (but that should be coming soon).
So to address the comment about fluors in the same channel, lets use BD Biosciences’s spectraviewer to look at the 2 dyes in question, and we’ll add in the next detector up that is used for BV510 on our system. The colored bands are the default emission filters used on the system with a long pass in between to split the signal.
You can see that the 440/40 filter only captures just over half of the peaks of BV421 and Pacific Blue signals and catches the tail of spillover from BV510. This prevents you from having to change the filters around with every change in fluorochrome, but you can see that if you always run BV421, you might want to switch to something like 425/20:

This catches the whole peak of BV421 while avoiding the majority of BV510 spillover. If you look at the spillover you get from BV510 into each of these filters there is a clear difference (same voltages for both plots):

And when you calculate the compensation matrix, the BV421-%BV510 drops from 30.6 for the 440/40 filter to 0.1% for the 425/20 at the same voltages. Less spillover means less spread, so comparing compensated BV510 stained beads using either filter and keeping the gate in the same position for both plots shows:

This spread makes it harder to distinguish dim double positives, so if we look at single and double positive events, more double positives don’t resolve themselves from the single positives in the 440/40 setup (2.7% vs 0.7%).
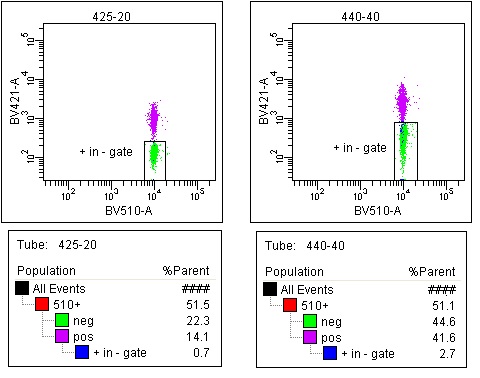
(I ran the populations separately so I could tell how much overlap there was).
With so many reagents to choose from, and different vendors using different names for the same thing, even the experts can lose track, and new tools are always welcomed. If you know of any programs, platforms, or websites that you find helpful in your flow cytometry research, please post it in the comments and I’ll add it to our links. Be sure to make use of the existing tools to learn about the properties of your reagents, and talk to your core managers to learn about the setup for your particular systems to get the best results from your experiments.
